Dr. Mudassar Altaf, Associate Professor of Chemistry, Department of Higher Education, Government of the Punjab, Pakistan
Contents:
- Phase change
- Heating curve
- Cooling curve
- Few other examples
Phase Changes:
This article describes heating and cooling curves based upon water at 1 atmospheric pressure (sea level). “The change of the state of matter” is called phase change as defined in https://chemiologist.com/change-of-state-of-matter/ . Further, melting point, freezing point, boiling point and condensation points have also been explained at this link. When a substance changes its appearance (phase) it absorbs or emits energy in the form of heat. In this way, there are two types of curves formed, heating and cooling curves.
Heating Curve:
Following table explains the segments of the curve for water from ice to gaseous phase.
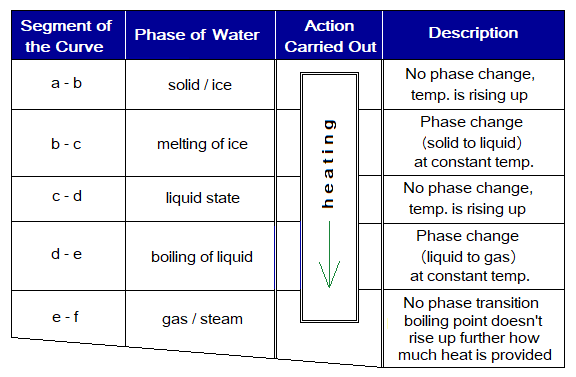
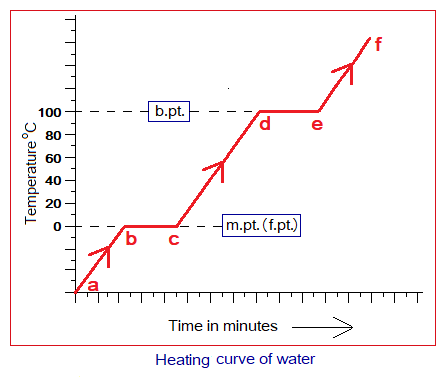
For ice, at point b the 0°C is the temperature where phase change begins to occur as shown in the heating curve. The b to c is a flat segment and temperature remains constant. The phase change takes place during this flat segment where ice takes time for melting. From point c, at 0°C, the temperature of the liquid-state again starts going up towards 100°C. At point d, 100°C is the temperature where the curve again shows a flat segment and the temperature remains constant but time goes on and at point e liquid starts boiling and converting to gas.
Cooling Curve:
Following table explains the segments of the curve for water from steam to ice.
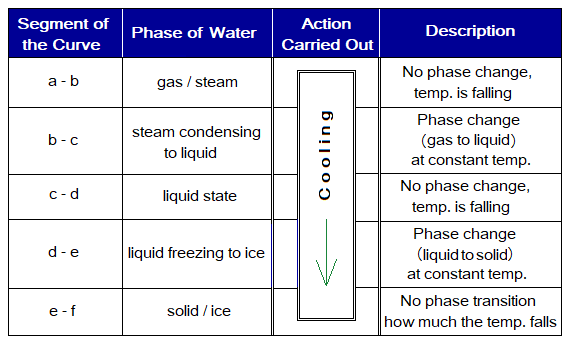
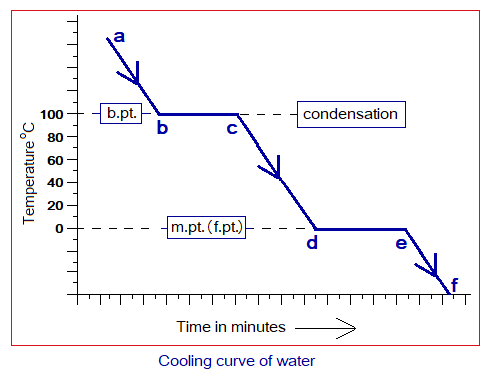
For steam, at point b the 100°C is the temperature where phase change begins to come about as shown in the cooling curve. The b to c is a flat segment and temperature remains constant. The phase change takes place during this flat segment which takes time and the steam condenses to liquid. From point c, at 100°C, the temperature of the liquid-state again starts going down towards 0°C. At point d, 0°C is the temperature where the curve again shows a flat segment and the temperature remains constant but time goes on and at point e liquid starts converting to ice.
Few Other Examples:
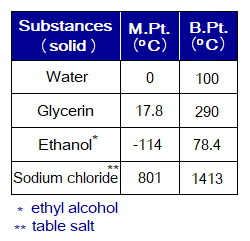
Various substances have their own melting and boiling points. Few examples are given here at 1 atmospheric pressure in the following table. Their heating and cooling curves are formed depending upon these values.